Some BI tools don’t natively support querying MongoDB databases. While you shouldn’t run data warehousing on MongoDB, it may still be desirable to build dashboards on top of MongoDB, even though it’s a NoSQL database. On one of my latest side projects, I am saving a web crawler output into a MongoDB collection and I would like to get a view of the number of ingested pages by source per day for example.
To do this, there are 3 ways that come to mind, and you only need the approach detailed in this article if you’re using an arbitrary BI service. If you you just want to make charts, there are tools that support MongoDB out of the box:
- If you use MongoDB Atlas, the Charts service in Atlas is actually pretty good and has a similar UX to Tableau.
- Two very popular services that support MongoDB out of the box are Grafana, and Tableau.
- If you still want to use an arbitrary BI tool, like Superset for example, some services do not support MongoDB out of the box.
In this article I will show you how to use Trino (Starburst Galaxy) to make a Superset dashboard on top of a MongoDB database.
You can either set up Trino locally (in which case you will need to write), or in my case I am using Starburst Galaxy, which is a managed platform built on top of Trino that provides a similar user experience as commercial data warehouses.
Step 1. Create a Starburst Galaxy account and cluster in a region close to your MongoDB instance.
Step 2. Create a MongoDB catalog (=datasource) on Starburst is pretty straightforward. I am a little annoyed that it doesn’t support Mongo URI strings, and notably if your connection string starts with mongo+srv, make sure to tick the DNS seedlist checkbox, this can be hard to find at first and the connection will not work if this is not set properly.
One feature I ADORE about Starburst is the test connection whenever you create one. I cannot believe how few data platforms implement this, as it can save precious debugging time.
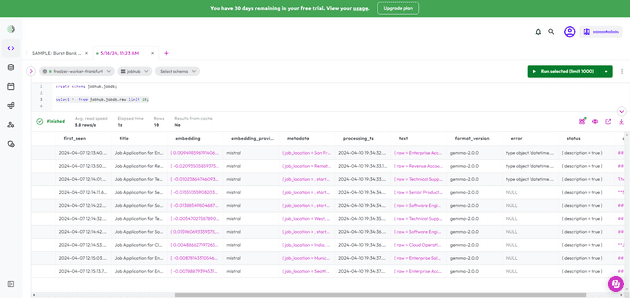
Step 3. Make your MongoDB collection visible. I find the process to query a collection not very intuitive. From what I gathered, you must first create a schema of the same name of the MongoDB database/namespace that contains your collections. This will create a _schema collection that basically contains the information schema. Next we can query our MongoDB database with SQL as below. Hourra! 🍾
Step 4. Connect your Starburst instance as a datasource in your favorite BI tool. I am using a local instance of Apache Superset deployed with Docker. It’s based on the official apache/superset image, with pip install trino.
To get the connection string for Superset, you should get to your cluster, and go to Connection Info. Unfortunately here, Starburst will not provide you with a directly usable connection string. You will probably see something like jdbc:trino://<host>:<port>?user=<username/email>/<role>, which you should transform to trino://<username/email>/<role>@<password><host>:<port>. If your password contains special characters, you should URL encode them. (i.e. slash is %2F, etc.)
Also, by default your Starburst account will only have an accountadmin role. It’s best to create a new role with less privileges for any BI use.
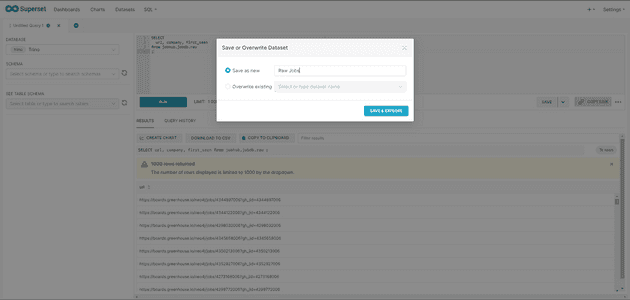
Step 5. Create a dataset in Superset. As again Superset was not able to list the schema I had defined in Starburst earlier, the alternative is to create a dataset with custom SQL. Also you will find that Superset will throw errors on weird non SQL fields (arrays, documents), so it is best to do your flattenings, etc. here, so that your charts access clean SQL table.
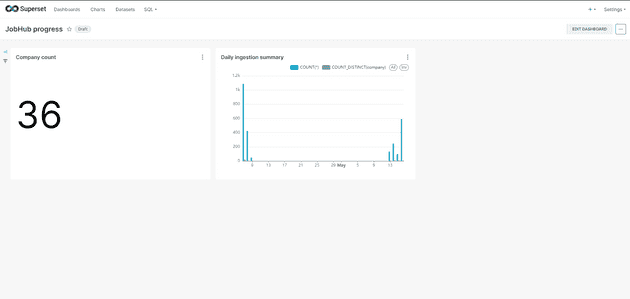
And there you have it. I’m able to use my MongoDB collections as if they were SQL tables:


